Animus
Experimental Case Study · Mental Health Visualization
Animus is an experimental concept designed to explore how emotional and mental health data could be visualized in a symbolic, ambient, and human-centered way. It began as a rejected direction from a health index project, but positive feedback on its emotional tone inspired me to pursue it further as a personal design exploration. The goal was to create a reflective tool that fosters self-awareness through gentle, intuitive visuals rather than clinical charts or metrics.
Client
Self-initiated Concept
Year
2021
Role
Concept Creator
Platform
Mobile Application · Prototype

My Role
Concept Creator
As the sole designer and creator of Animus, I led the entire project — defining the concept, designing the visual and interaction systems, and creating the prototype and motion studies. I also conducted guerrilla user testing to observe engagement and gather insights for refinement.
The Challenge
Problem
Traditional mental health tools often rely on clinical charts, graphs, and metrics that can feel overwhelming, impersonal, or judgmental. These approaches can make emotional tracking feel like a task rather than a supportive practice, limiting user engagement and emotional connection.
Design Goal
The aim of Animus was to explore whether symbolic, ambient visuals could create a more reflective, intuitive, and emotionally resonant way for users to engage with their mental health data. I wanted to create a design language that encourages gentle self-awareness rather than data scrutiny.
Constraints
This was a conceptual, self-driven project without client resources, user research budgets, or technical implementation. I relied on informal guerrilla testing, self-guided research, and prototyping to validate and refine the idea, balancing creative exploration with practical usability considerations.

The Discovery
Visual Metaphors
Animus’s core premise is that visual metaphors—not numbers—can drive self-reflection, so the prototype centered entirely on testing the emotional impact and clarity of its landscapes. To validate this visually driven concept quickly, I built a low-fidelity mobile prototype in Figma and tested it with 10 participants in public settings.
Prototype
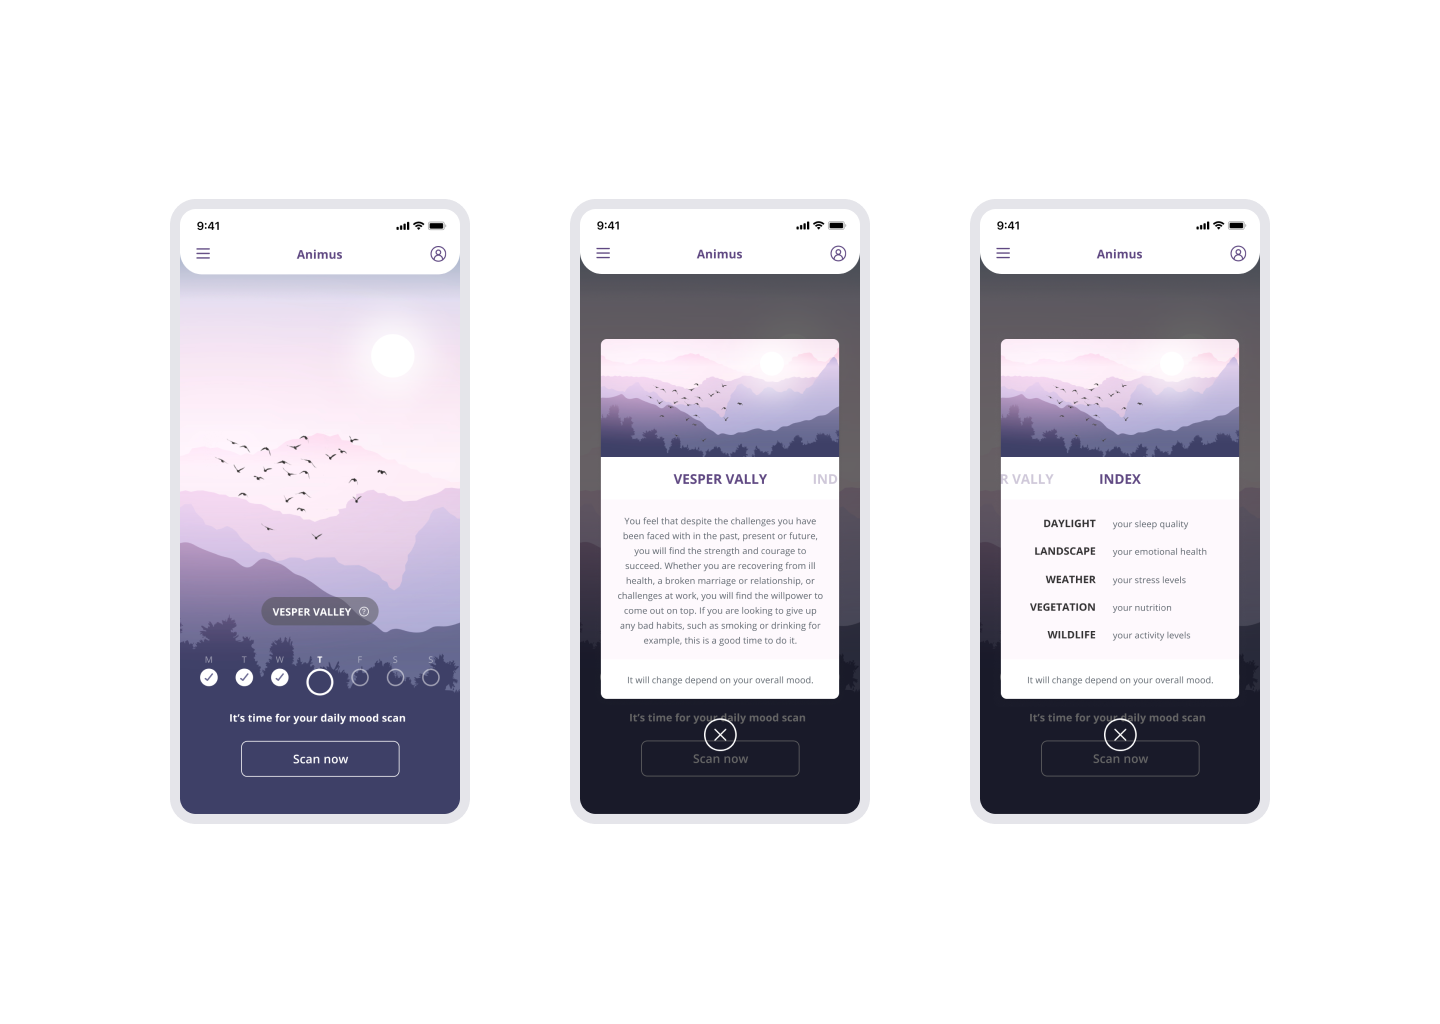
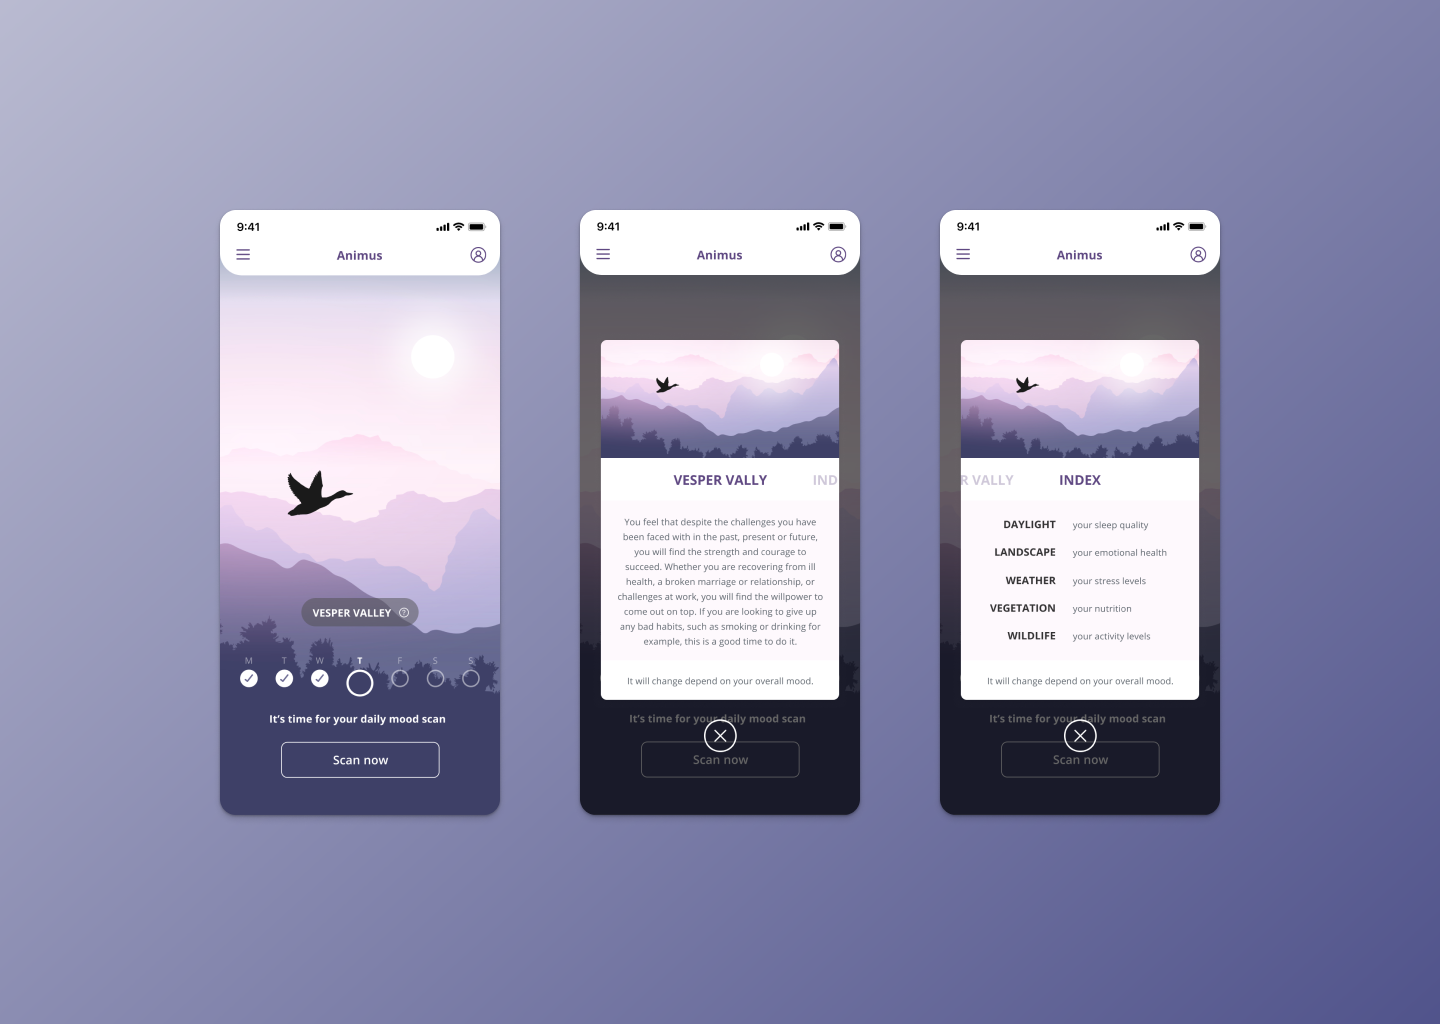
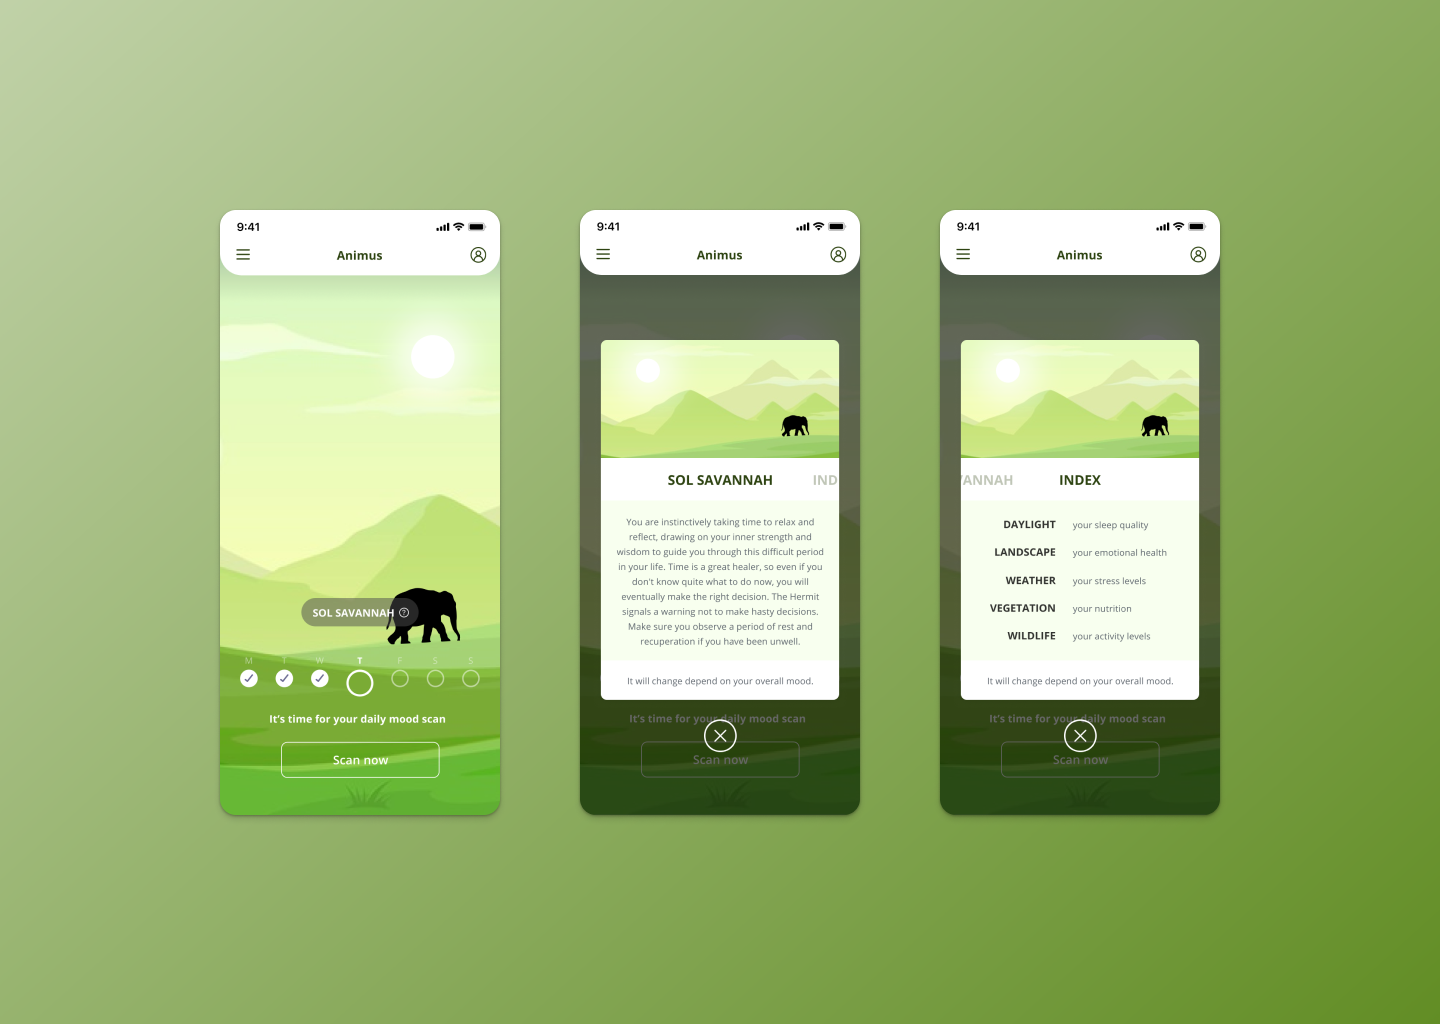
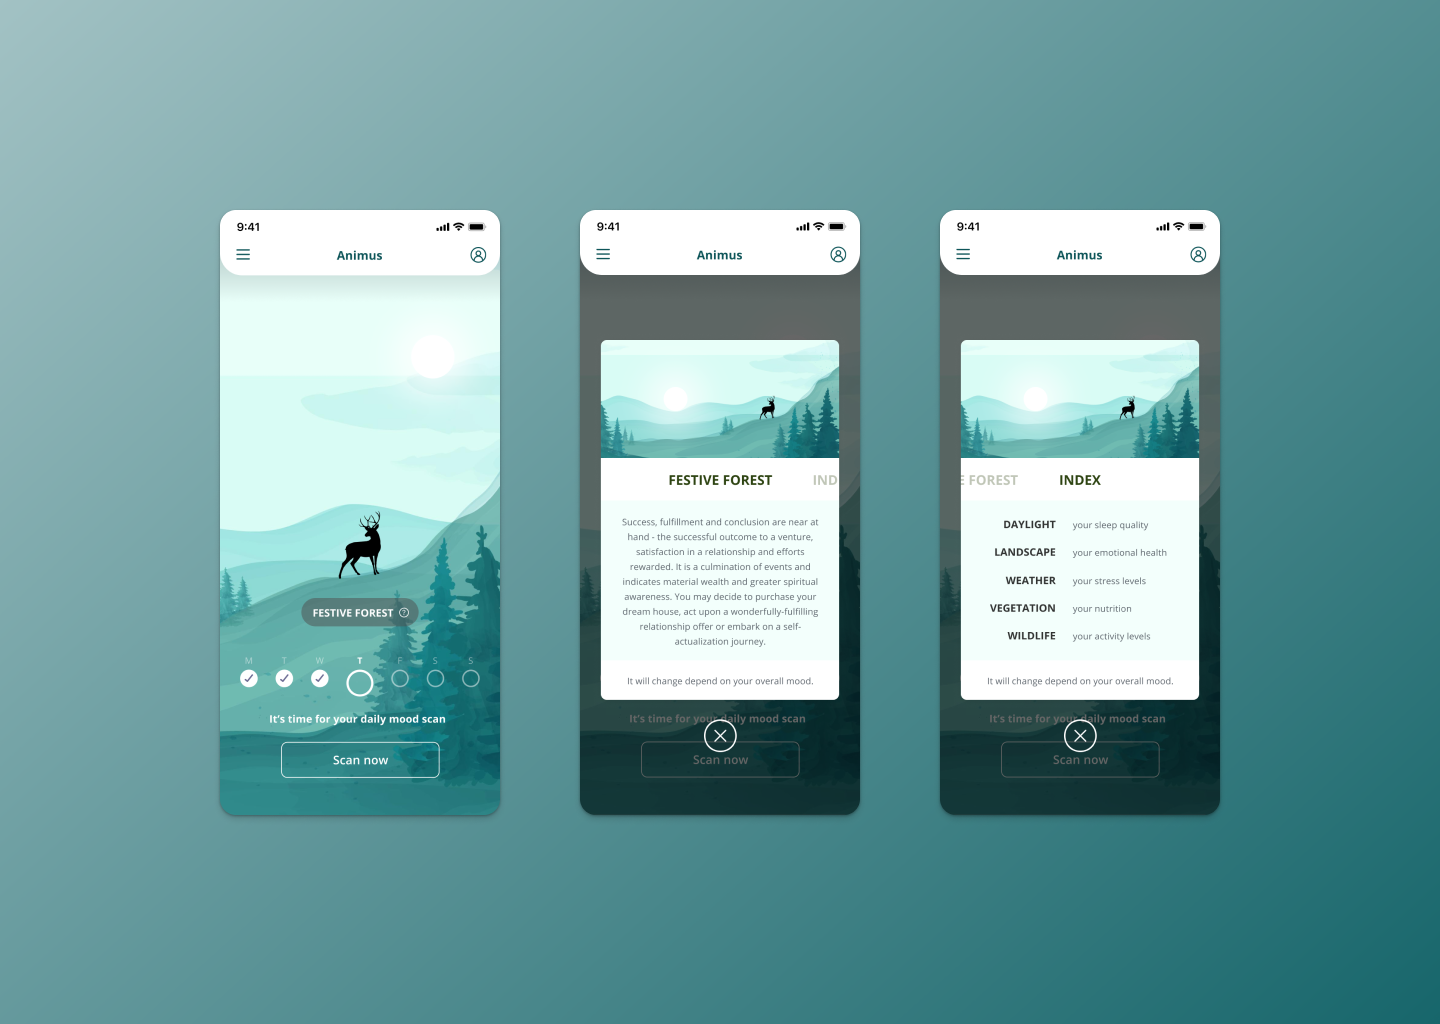
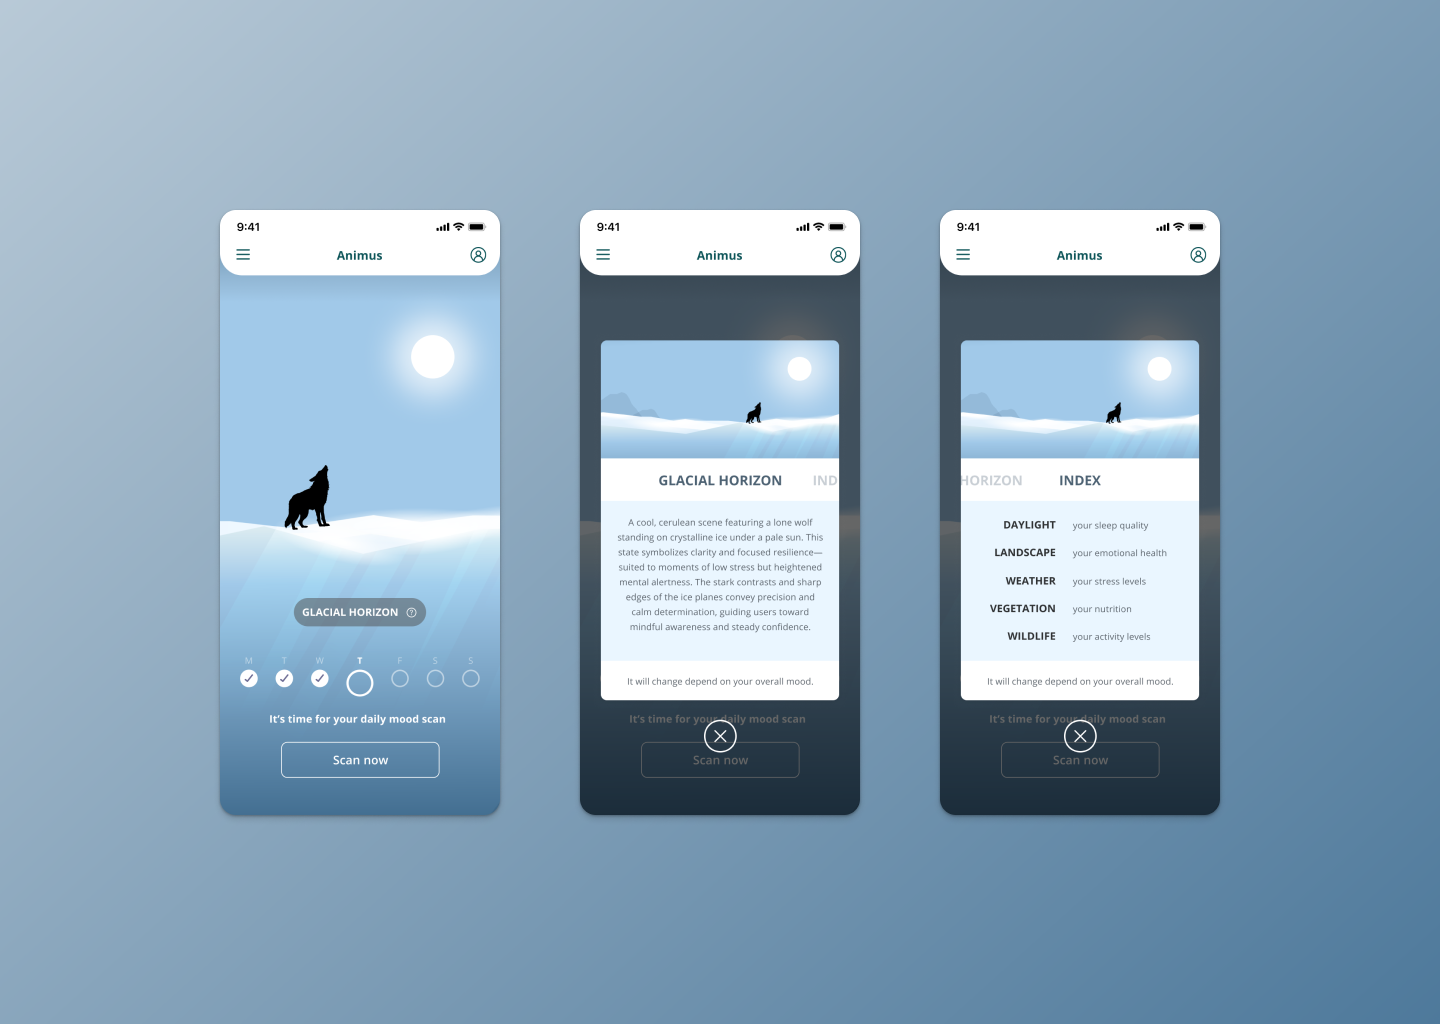
The prototype focused on the Vesper Valley state and included three key screens.
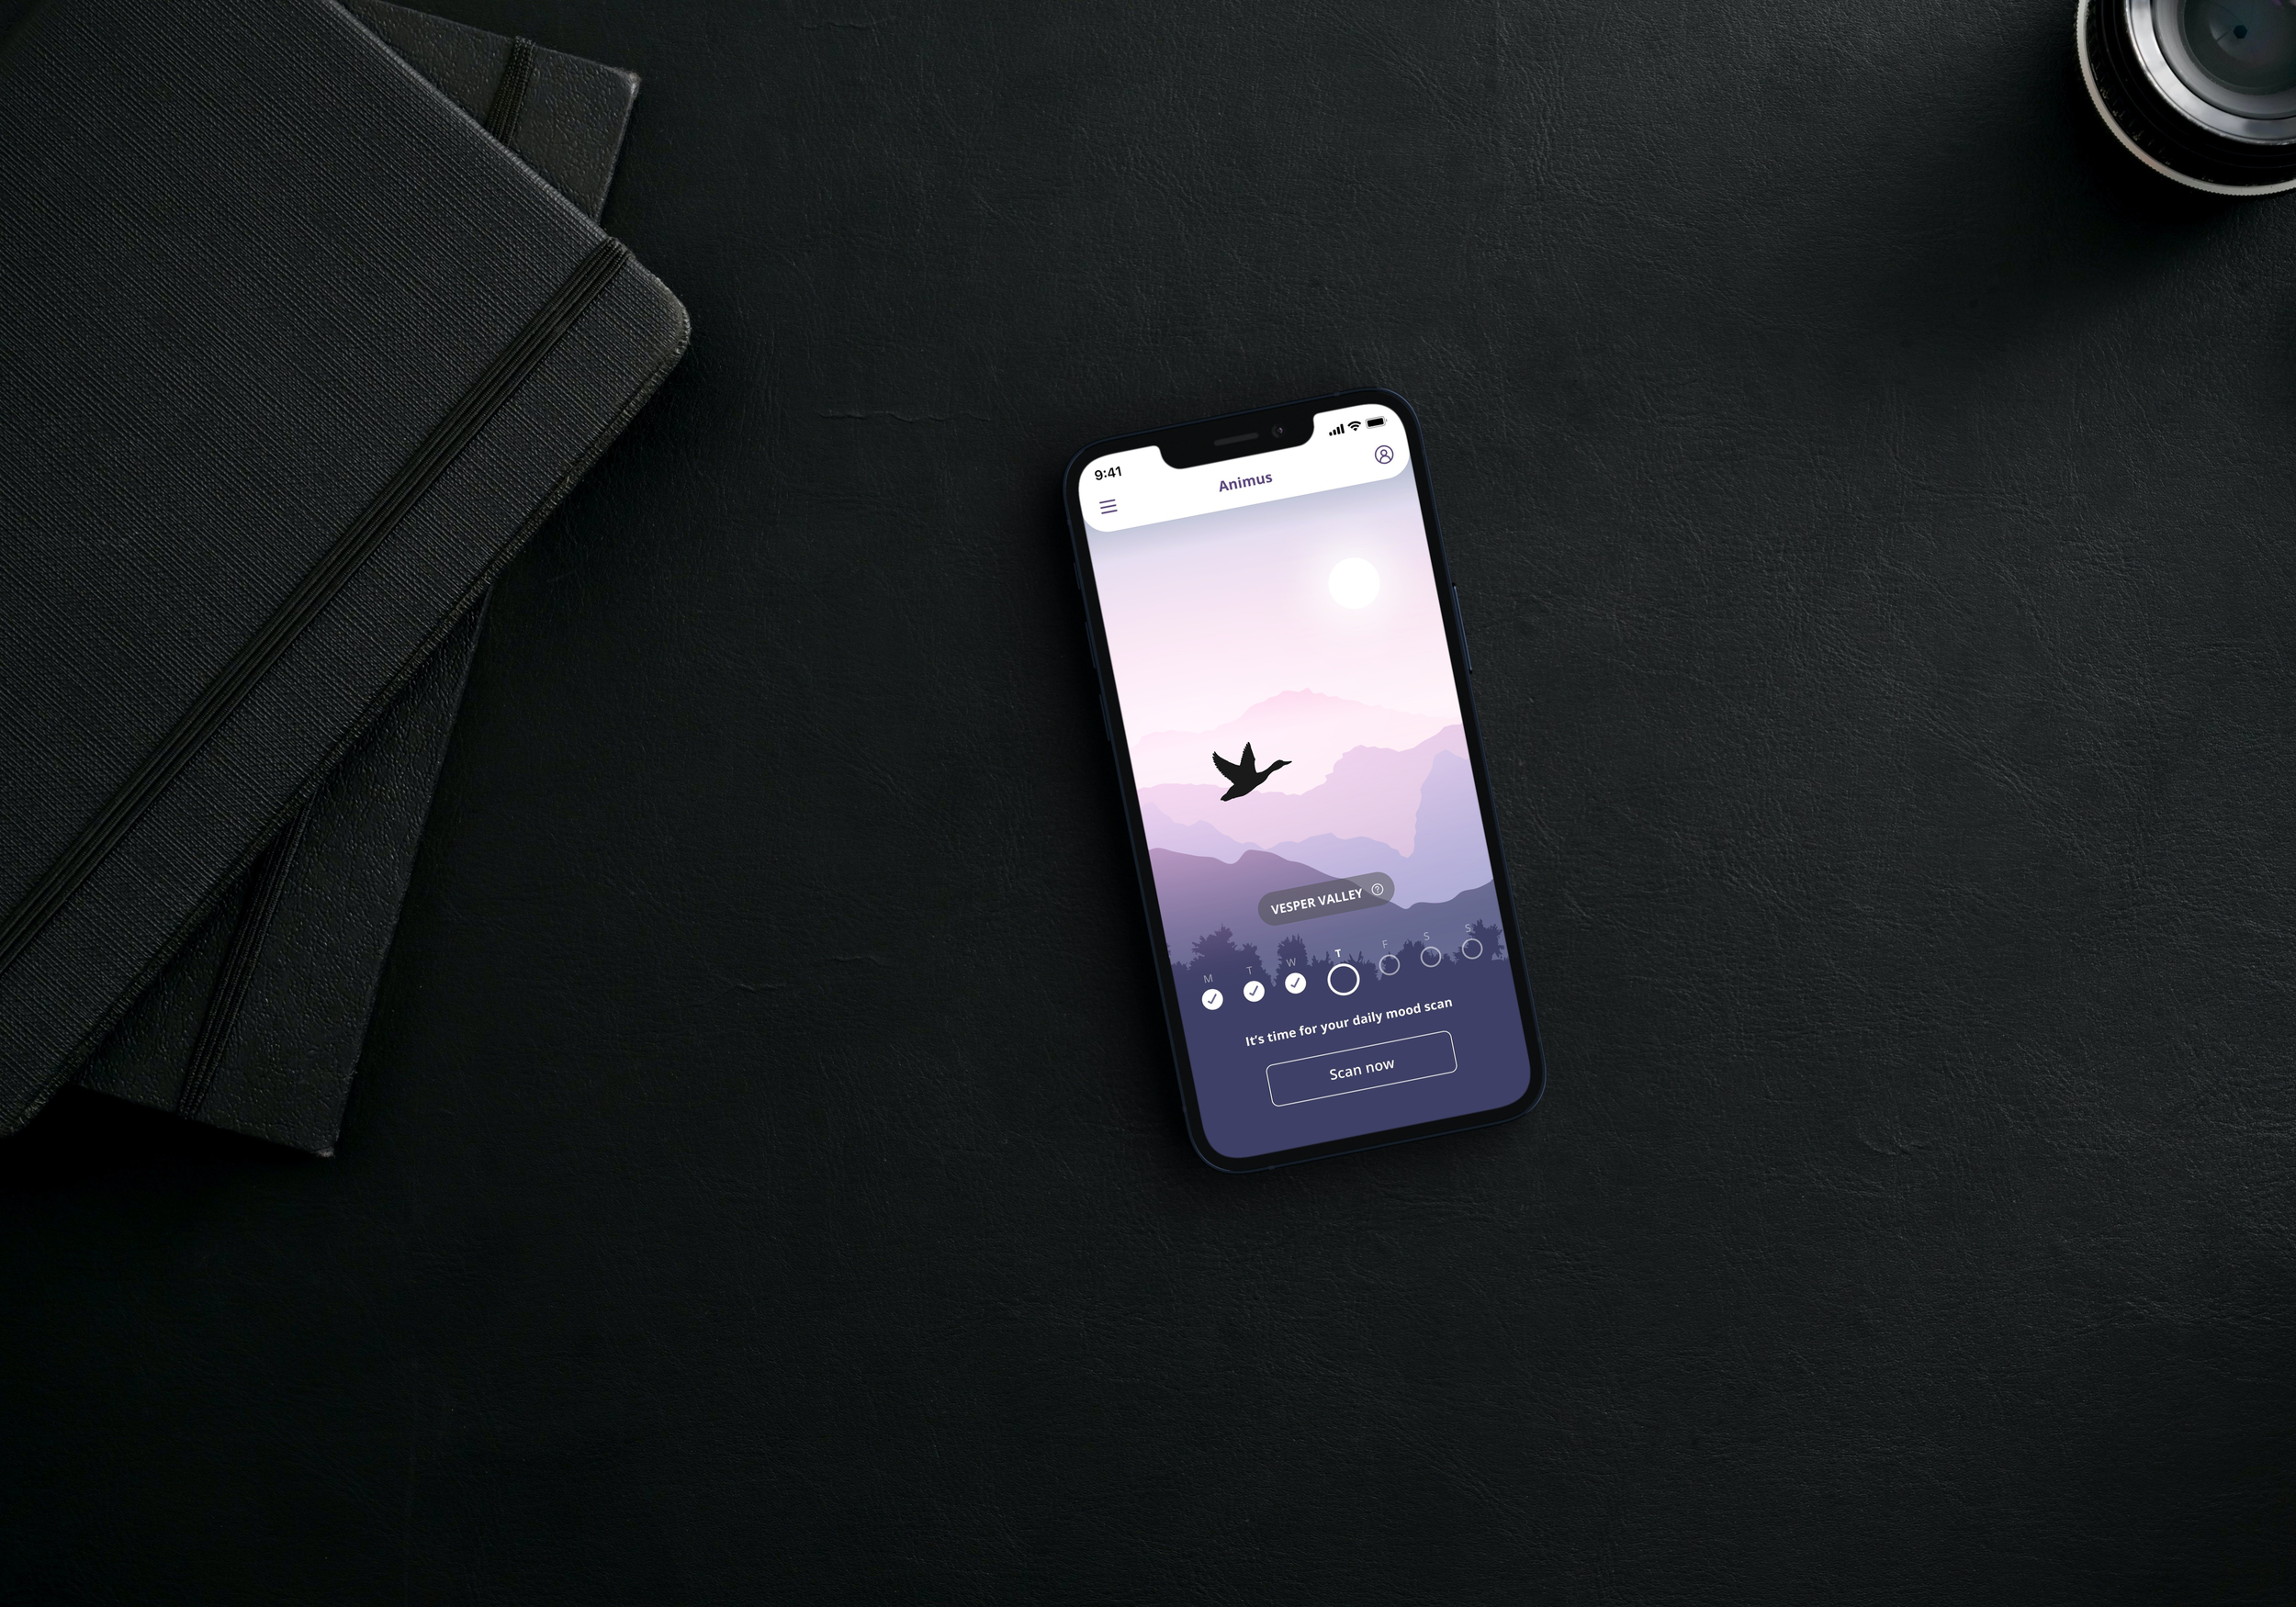
State View
A pastel-rendered mountain landscape at dawn, overlaid with the “Vesper Valley” label and a weekly progress tracker (M–S). Tapping the “Scan now” button simulated a daily mood scan, emphasizing the emotional tone and check-in interaction without any numeric readouts.Insight Overlay
After scanning, a modal card slid up to reveal contextual guidance in human-centered language (e.g., “You feel that despite the challenges…”). This screen tested whether users engaged with and understood the narrative feedback in the absence of charts or numbers.Index Card
A secondary tab on the modal displayed an “Index” legend—mapping each visual metaphor to its meaning (Daylight = sleep quality, Landscape = emotional health, etc.). This allowed evaluation of users’ need for an on-demand guide to interpret the abstract visuals.
By guiding participants through landscape → narrative insight → symbolic index, the sessions revealed how well a purely visual approach could convey meaning and where additional clarity (such as context cards or legends) was necessary.
Guerrilla Testing
I conducted informal guerrilla testing with 10 random participants in everyday environments. I asked them to interact with early visual prototypes and motion studies, and observed their reactions. This low-cost, quick testing approach offered valuable insights into how users perceived and interpreted the symbolic visuals. It also surfaced key pain points, such as difficulties understanding complex visual metaphors at a glance, or challenges with syncing smartwatch data.
“It feels peaceful — not like I’m being judged by my own data.”

“I wasn’t expecting it to look like this — it’s really creative, but I’d need help understanding what the symbols mean.”

“It’s beautiful — I feel like I’m looking at a painting of my mood.”
“I wish I could set my own daily goals or reminders that fit my routine.”
“I want to keep my data private, but I also think it could be nice to share with a supportive group.”
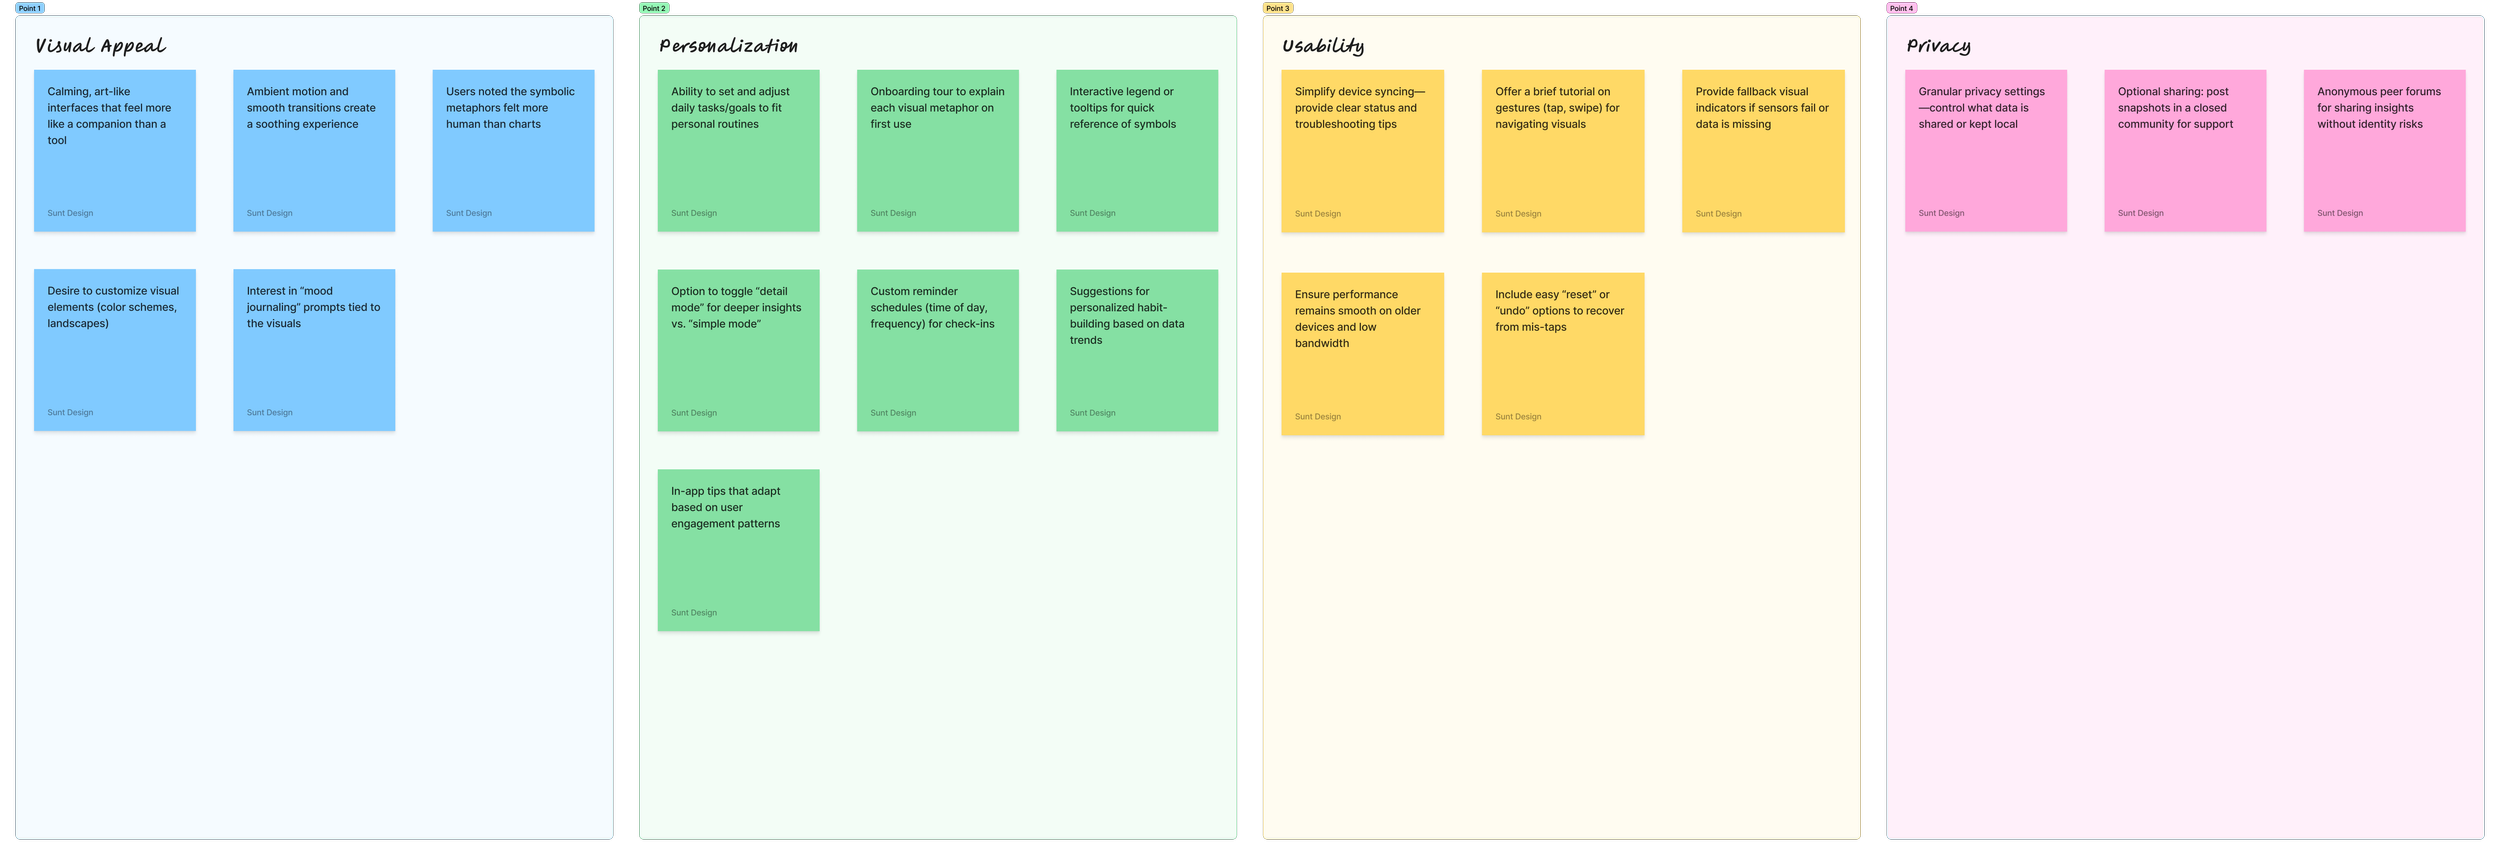
Key Insights
From these activities, several themes emerged. Users were drawn to the visual appeal of Animus, describing it as calming and engaging. Many expressed a desire for personalization — the ability to tailor daily tasks and goals to their individual preferences. I also noted how varying levels of tech confidence shaped their experience: while some navigated the prototype easily, others struggled with interpreting abstract elements or handling technical tasks like device syncing. Importantly, users formed an emotional connection with Animus, seeing it as a companion rather than just a tracker. At the same time, they highlighted a tension between wanting privacy for their personal data and curiosity about connecting with others for support.

The Design
Visual Mapping Logic
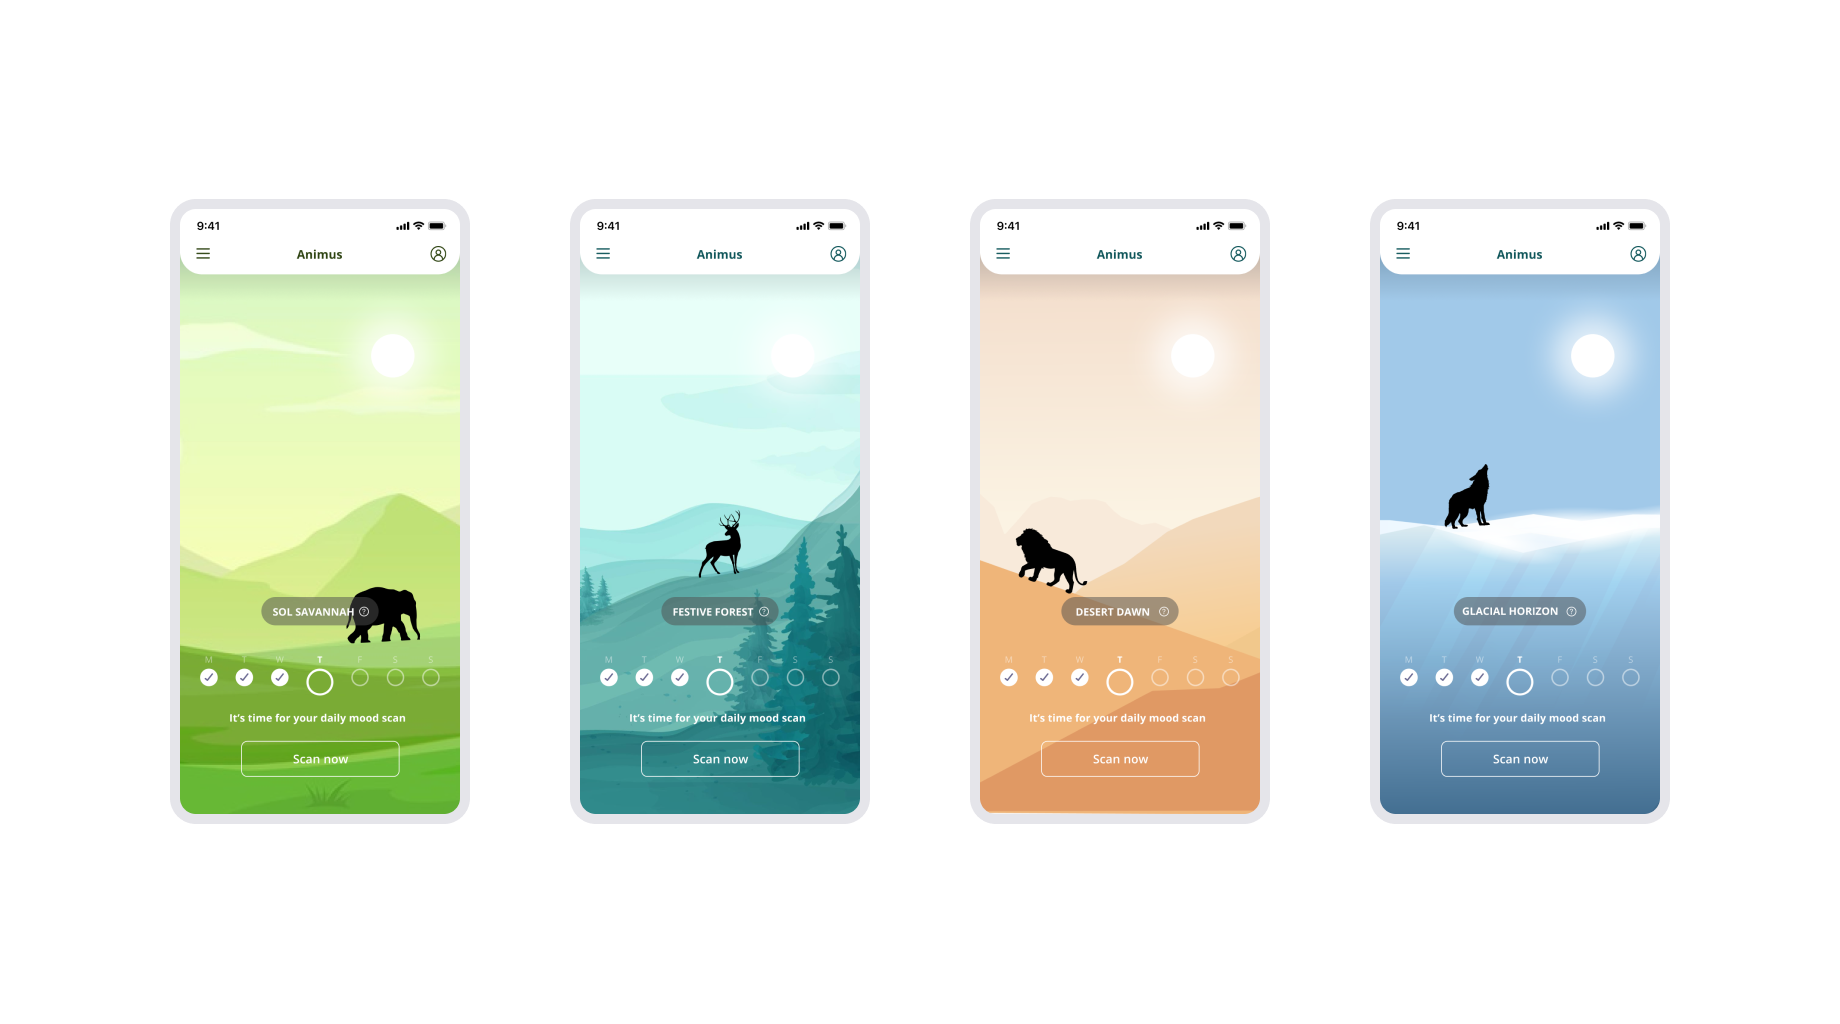
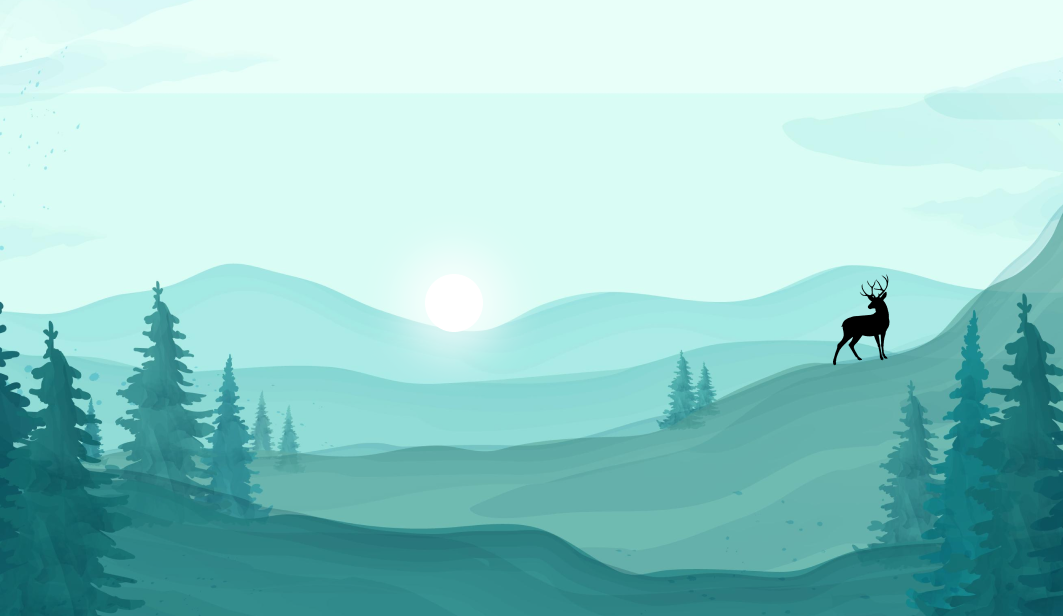
At the heart of Animus is a visual language that transforms mental health data into a single, dynamic scene—one that speaks to users on an emotional level rather than through numbers. Rather than portraying group behaviors (like a flock of birds), I refined the prototype to feature a lone animal—giving each visualization more singular focus and reinforcing the sense of personal reflection. In this system, natural elements serve as metaphors for well-being: the sky’s brightness shifts with sleep quality; the terrain’s smoothness or jaggedness mirrors emotional stability; weather patterns reflect stress levels; vegetation density hints at nutritional health; and the presence of wildlife signals activity levels. By weaving these elements together into one cohesive tableau, Animus offers an ambient, intuitive portrait of daily well-being that users can immediately connect with.
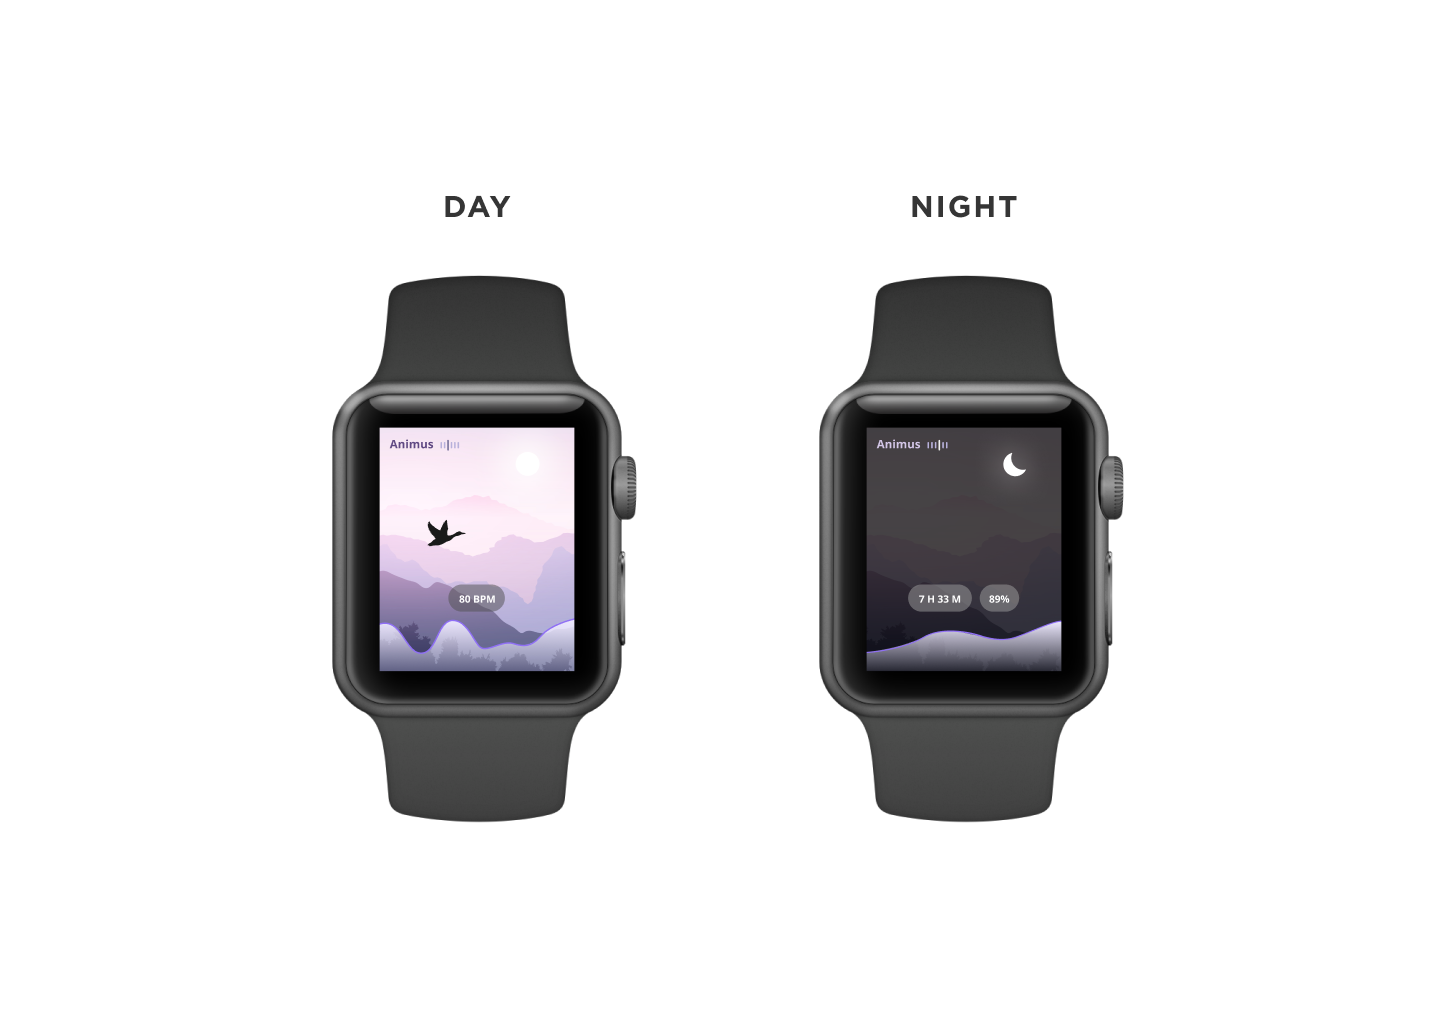
Interface and Interaction Design
To keep users immersed in the ambient experience, data entry in Animus is fully automated via smartwatch and phone sensors—capturing heart rate, sleep patterns, and activity levels without any manual effort. This passive data collection lets the visuals update seamlessly in the background, ensuring the interface remains minimal and unobtrusive. Gentle motion and fluid transitions guide users through their evolving well-being tableau, while subtle daily prompts—delivered via push notifications—invite them to engage in quick mindfulness or movement exercises. By shifting the burden of data entry onto familiar wearable devices, the design reinforces Animus’s role as a supportive companion rather than a traditional tracker or dashboard.
Motion and Emotional Tone
Motion is the heartbeat of Animus, transforming static scenes into an evolving, living landscape. To deepen the sense of variety, I introduced multiple terrain and horizon variations—rolling hills, rocky cliffs, serene lakeshores, and misty forests—each paired with its own subtle animation cycle. Transitions borrow from natural rhythms: morning dew glistens into sunrise, clouds drift to reveal storm breaks, and foliage gently sways in an unseen breeze. By layering these diverse landscapes and ensuring every change unfolds with smooth, organic movement, Animus maintains variety and visual interest while preserving its calm, reflective atmosphere. The result is a dynamic tapestry that feels both alive and soothing, perfectly suited to guide users through their emotional journeys.
The Result
Concept Impact
Animus, as a conceptual prototype, demonstrated the potential of using symbolic, ambient visuals to foster a gentler and more emotionally engaging approach to mental health tracking. Testing participants described the experience as calming and reflective, with one sharing:
“It’s beautiful — I feel like I’m looking at a painting of my mood.”
The design offered users a sense of companionship rather than clinical monitoring, helping differentiate it from traditional mood-tracking apps. At the same time, testing revealed areas where abstract visuals could be clearer and more intuitive at a glance.

Final Deliverables
Symbolic Mapping System: A complete visual language linking sleep, emotion, stress, nutrition, and activity into a cohesive ambient scene.
Interactive Prototype: high-fidelity flows demonstrating fully automated data capture via smartwatch and phone sensors, plus contextual “Scan now” interactions.
Expanded Landscape Library: Multiple terrain and horizon variations—rolling hills, rocky cliffs, serene lakeshores, misty forests—each featuring a single-animal focus to reinforce personal reflection.
Interaction Guidelines: Detailed specs for passive data integration, subtle daily prompts, and fluid transitions that support gentle habit-building without overwhelming users.
Design Framework: A scalable foundation for future emotional-UX and ambient data explorations, incorporating visual mapping, automated inputs, and varied landscape assets.


The Reflection
What I Learned
Animus was a rewarding exploration of how emotional design and data visualization can intersect. It reinforced for me that design is not only about clarity and function, but also about creating experiences that resonate on a human and emotional level. The project showed how abstract, symbolic forms can successfully foster engagement and connection — but also how they present unique challenges in usability and interpretation.
What I Would Improve
If I were to continue developing Animus, I would focus on enhancing the clarity of the visual language so that users could interpret their emotional state at a glance, without relying on guides or explanations. I would also explore ways to balance ambient beauty with more actionable feedback, so users could move from reflection to meaningful insight or behavior change more easily.
What Comes Next
Animus fulfilled its purpose as a personal, curiosity-driven experiment. While I see potential for further development — perhaps as part of future wellness or ambient data projects — I felt satisfied closing this chapter, and I carry forward the lessons into future work on emotional UX and reflective design.